Test Index
Xavier Aptitude Test 2025 Paper
Show Para
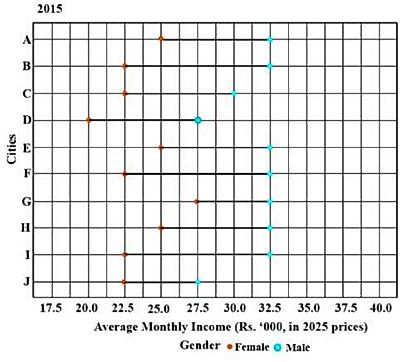
Question Numbers: 20-22Read the following scenario and answer the THREE questions that follow.Comprehension:The plots below depict and compare the average monthly incomes (in Rs. '000) of males and females in ten cities of India in the years 2005 and 2015. The ten cities, marked A-J in the records, are of different population sizes. For a fair comparison, to adjust for inflation, incomes for both the periods are scaled to 2025 prices.Each red dot represents the average monthly income of females in a particular city in a particular year, while each blue dot represents the average monthly income of males in a particular city in a particular year. The gender gap for a city, for a particular year, is defined as the absolute value of the average monthly income of males, minus the average monthly income of females, in that year.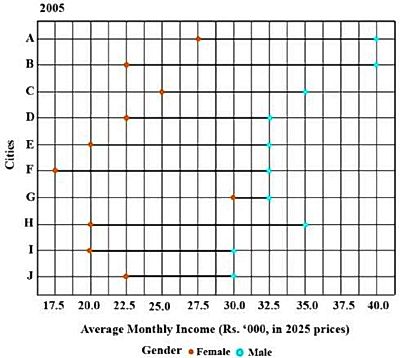
© examsnet.com
Question : 21 of 95
Marks:
+1,
-0
Go to Question: