Test Index
UPSC Civil Services 2011 Prelims General Studies Paper II
Show Para
Directions for the following que 26-27 : The following pie charts show the break up of disease categories recorded in the patients from two towns, Town A and Town B. Pie charts plot the disease categories as percentage of the total number of patients. Based on these answer the two items that follow the charts. 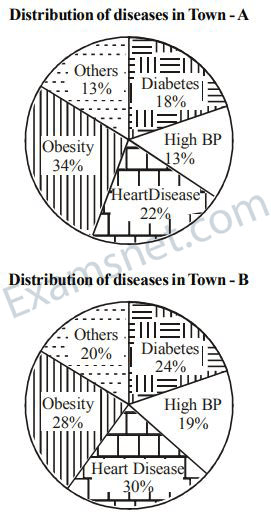
© examsnet.com
Question : 26 of 80
Marks:
+1,
-0
Go to Question: