Test Index
TS ICET 30 Sep 2020 Shift 2 Paper
Show Para
Question Numbers : (49 to 53) The following Pie-chart shows the budget allocation of a company under different heads P, Q, R, S, T in one financial year. Based on the information given, answer the questions from 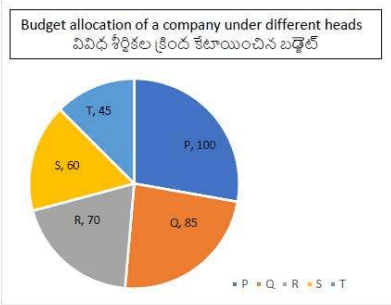
| P | 100° |
| Q | 85° |
| R | 70° |
| S | 60° |
| T | 45° |
© examsnet.com
Question : 51 of 200
Marks:
+1,
-0
Go to Question: