Test Index
TS ICET 30 Sep 2020 Shift 2 Paper
Show Para
Question Numbers : (46 to 48) The following graph depicts the profits earned by a company through exports in the past six years. Based on this data, answer the questions 46,47 and 48 . 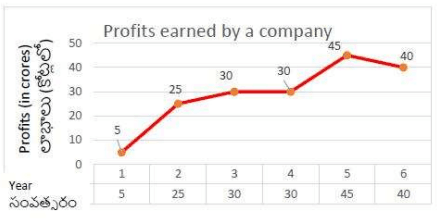
© examsnet.com
Question : 47 of 200
Marks:
+1,
-0
Go to Question: