Test Index
TS ICET 24 May 2018 Shift 1 Paper
Show Para
Directions for questions 49 to 53:
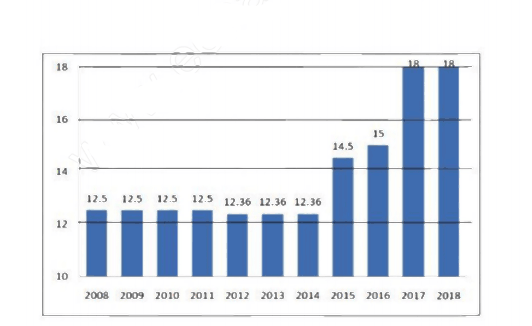
Observe the bar graph showing Indian sales tax rates during 2008 to 2018. Problem Solving — Data Analysis Answer questions numbered 49 to 53.© examsnet.com
Question : 50 of 200
Marks:
+1,
-0
Go to Question: