Test Index
TS ICET 23 May 2018 Shift 1 Paper
Show Para
Directions for questions 46 to 48:
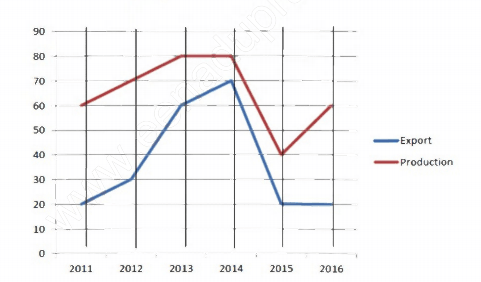
The following graph summarizes production and export details of an industry over the past 6 years 2011 to 2016. Based on the data given in the graph answer the following question© examsnet.com
Question : 46 of 200
Marks:
+1,
-0
Go to Question: