Test Index
TS ICET 20 Aug 2021 Shift 1 Paper
Show Para
Question Numbers : (49 to 53) The following Pie chart shows the income of a state under different heads. Based on the information given in the chart answer questions from 49 to 53 .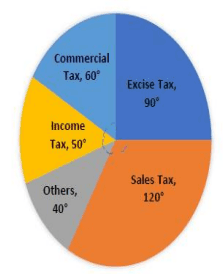
| Excise Tax | 90° |
| Sales Tax | 120° |
| Others | 40° |
| Income Tax | 50° |
| Commercial Tax | 60° |
© examsnet.com
Question : 49 of 200
Marks:
+1,
-0
Go to Question: