Test Index
TS ICET 19 Aug 2021 Shift 2 Paper
Show Para
The following Venn diagram shows the number of students in a college who study the courses and . Based on the information given, answer the questions 54 and 55 .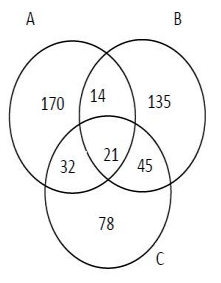
© examsnet.com
Question : 54 of 200
Marks:
+1,
-0
Go to Question: