Test Index
TG ICET 2025 9th June 2025 Shift 1
Show Para
Question Numbers : (52 to 55) The following Venn-diagram gives percentage of people speaking different languages in a city. Using this data answer questions from 52 to 55 . 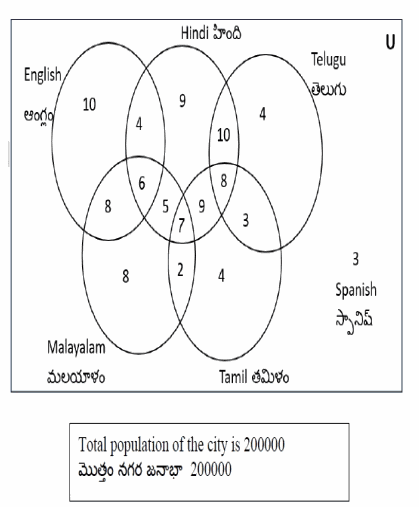
© examsnet.com
Question : 55 of 200
Marks:
+1,
-0
Go to Question: