Test Index
TG ICET 2025 8th June 2025 Shift 1
Show Para
Question Numbers : (49 to 51) The following Pie-Chart depicts the students who play different games in two colleges A andB. Based on this information, answer the questions from 49 to 51 .Number of students in the college Number of students in the college B = 1500 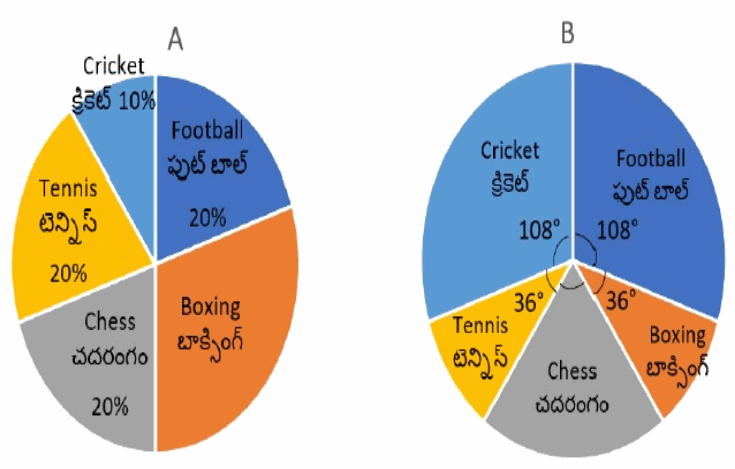
© examsnet.com
Question : 51 of 200
Marks:
+1,
-0
Go to Question: