Test Index
SSC MTS Model Paper 6
Show Para
Directions (Q. 46 − 50): The following bar graph depicts the result of B.Sc. students of a college for three years. Read the graph and answer the questions based on this graph.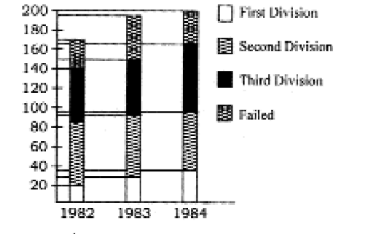
Go to Question: