Test Index
SSC MTS 17 Sep 2017 Shift 3 Paper
Show Para
Question Numbers: 72-75 Directions: The bar graph given below shows the production (in ‘000 tonnes) of rice of a country for the year 2007 to 2011.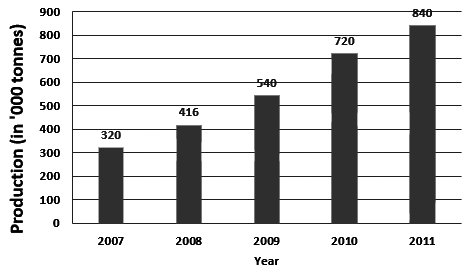
© examsnet.com
Question : 74 of 100
Marks:
+1,
-0
Go to Question: