Test Index
SSC CPO SI and ASI Model Paper 8
Show Para
Directions (Q. 137–140): Study the following bar graph carefully and answer the questions given below: The bar graph below shows the demand and production of five companies P, Q, R, S and T.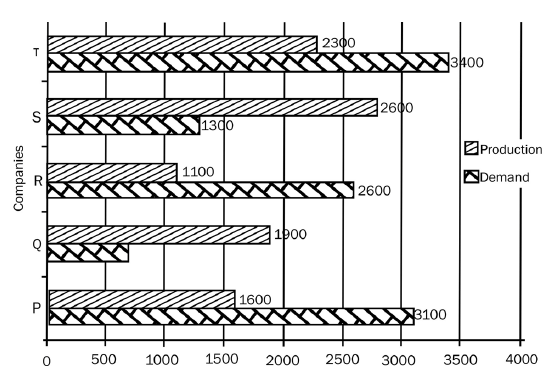
© examsnet.com
Question : 138 of 200
Marks:
+1,
-0
Go to Question: