Test Index
SSC CPO SI and ASI Model Paper 5
Show Para
Directions (Q. 147–150): Read the below bar graph carefully and answer the following questions: The below bar graph shows the price (in ` per kg) of different commodities during the last 6 months.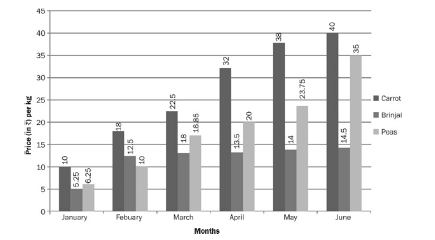
Go to Question: