Test Index
SSC CPO SI and ASI Model Paper 4
Show Para
Directions (Q. 146–150): The pie charts given below show the distribution of total number of cars (petrol & diesel) sold by eight companies and the number of diesel cars sold by the same companies. Study the graphs and mark the appropriate answers. Distribution of total number of cars (petrol & diesel) Total number of cars (petrol & diesel) = 8400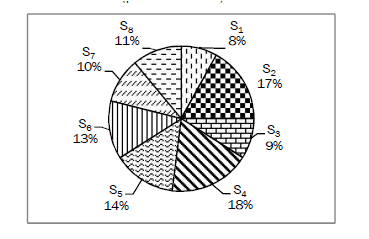 Distribution of number of diesel carsTotal number of diesel cars = 4500
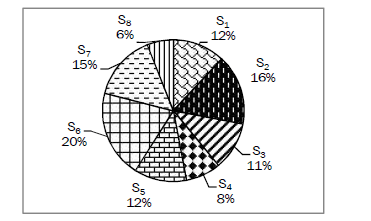
© examsnet.com
Question : 148 of 200
Marks:
+1,
-0
Go to Question: