Test Index
SSC CPO SI and ASI 2014 Paper
Show Para
Directions (Q. 146–150) : Study the bar graph given below and answer the questions that follow. Demand and production of colour TVs of five companies A, B, C, D and E (Number on the top of a bar is the number of colour TVs)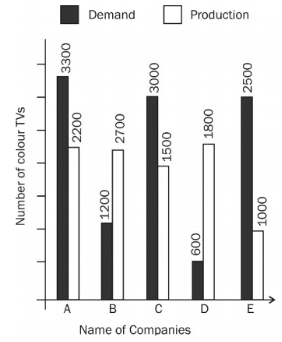
© examsnet.com
Question : 148 of 200
Marks:
+1,
-0
Go to Question: