Test Index
SSC CPO 9 Dec 2019 Shift 1 Paper
Show Para
Question Numbers: 133- The given pie-chart represents the distribution of the percentage of sales of a particular brand of car from five showrooms A, B, C, D and E during 2018. The total number of cars sold during that year from the five showrooms is 5000.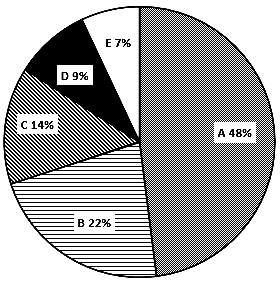
© examsnet.com
Question : 133 of 200
Marks:
+1,
-0
Go to Question: