Test Index
SSC CPO 2 July 2017 Shift 1 Paper
Show Para
Question Numbers: 122-125 The bar graph given below represents revenue of a firm for 8 years. All the revenue figures have been shown in terms of Rs. crores.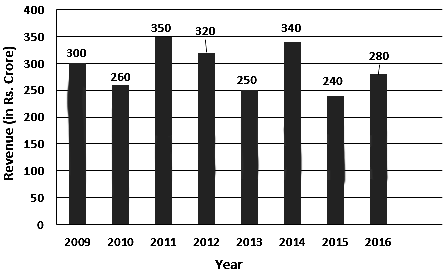
© examsnet.com
Question : 122 of 200
Marks:
+1,
-0
Go to Question: