Test Index
SSC CHSL 7 Mar 2018 Shift 1 Paper
Show Para
The pie chart shows the breakup of expenditure of a manufacturing company for the year 2017. Study the diagram and answer the following questions. 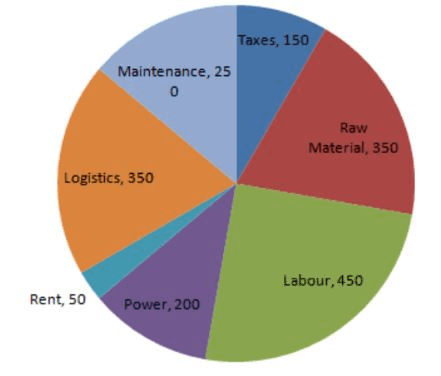
Go to Question: