Test Index
SSC CHSL 15 Nov 2015 Shift 2 Paper
Show Para
The following chart represents Demand and Production for 5 companies ABCDE.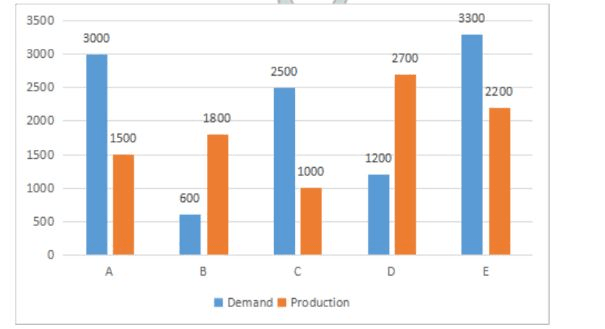 On the basis of graph answer the question below given.
© examsnet.com
Question : 144 of 200
Marks:
+1,
-0
Go to Question: