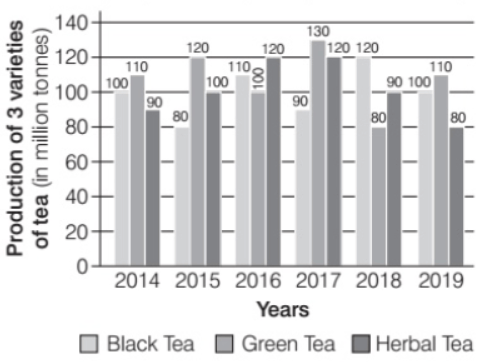
According to the bar graph, Average production of black tea in 2014,2015 and 2018 =3100+80+120=3300=100 million tonnes. Average production of green tea in 2016,2017 and 2019 =3100+130+110=3340=113.33 million tonnes.∵100<113.33, therefore average production of black tea in 2014,2015 and 2018 is less than average production of green tea in 2016, 2017 and 2019.∴ Required decrement =113.33−100=13.33 million tonnes.