Test Index
SSC CGL Model Paper 4
Show Para
Directions (Q.Nos. 72-75) The bar graph shows the population density of 6 countries. Study the diagram and answer the following questions. 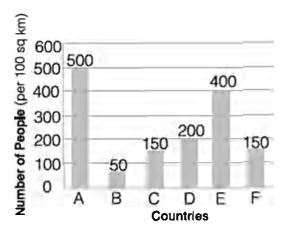
© examsnet.com
Question : 74 of 100
Marks:
+1,
-0
Go to Question: