Test Index
SSC CGL 17 Aug 2017 Shift 2 Paper
Show Para
Directions (Q.Nos. 72-75) The bar graph shows annual inflation in two years 2015 and 2016 of four countries (A, B, C, D). Study the diagram and answer the following questions. 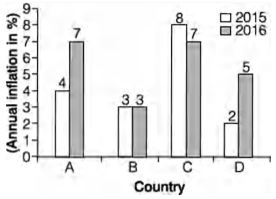
© examsnet.com
Question : 75 of 100
Marks:
+1,
-0
Go to Question: