Test Index
SBI PO Prelims Model Paper 9
Show Para
Directions (46 - 50): Answer the questions based on the following information. The following bar chart gives the growth percentage in the number of households in middle, upper-middleand high-income categories in the four regions for the period between 1987 - 88 and 1994 - 95. The number of households in each category were equally distributed in all the regions. 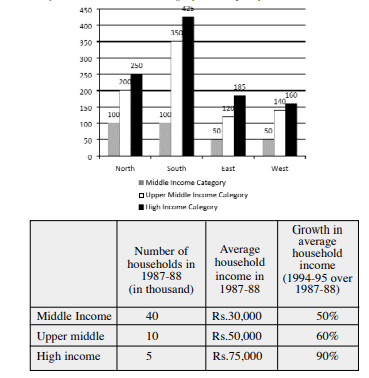
© examsnet.com
Question : 49 of 100
Marks:
+1,
-0
Go to Question: