Test Index
SBI PO Prelims 4 Aug 2025 Shift 2 Paper
Show Para
Question Numbers: 54-58Directions: Study the following information carefully and answer the questions.A pie chart below shows the percentage distribution of the total number of goods manufactured by five different companies: A, B, C and D.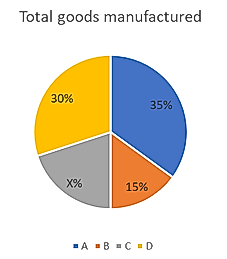 A table below shows the percentage of goods sold by each of the four companies.
Note: The total number of goods manufactured is 200.
| Shop | Percentage of Goods Sold |
| A | 70% |
| B | 80% |
| C | 60% |
| D | 90% |
© examsnet.com
Question : 54 of 100
Marks:
+1,
-0
Go to Question: