Test Index
SBI PO Mains Model Papers 4
Show Para
DATA ANALYSIS & INTERPRETATION Directions (Q. 81 - 85): Study the following graph carefully and answer the questions given below: Percentage growth in population of six towns A, B, C, D, E and F from 2014 to 2015 and from 2015 to 2016. 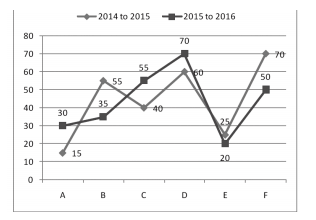
© examsnet.com
Question : 81 of 155
Marks:
+1,
-0
Go to Question: