Show Para
Directions (Q. 106 - 110): Study the following information and answer the given questions.
  Pie-chart I shows the percentage of students in various courses A, B, C, D, E and F and pie-chart II shows the percentage of boys.
Total students 2600 (1800 boys + 800 girls)
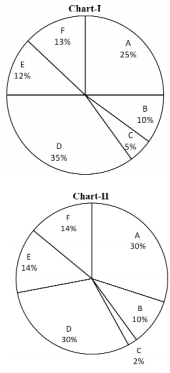
  Pie-chart I shows the percentage of students in various courses A, B, C, D, E and F and pie-chart II shows the percentage of boys.
© examsnet.com
Question : 107
Total: 155
Go to Question:
More Free Exams:
- IBPS Clerk Mains Previous Papers
- IBPS Clerks Model Papers
- IBPS Clerks Previous Papers
- IBPS PO Mains Previous Papers
- IBPS PO Model Papers
- IBPS PO Previous Papers
- IBPS RRB Officers Previous Papers
- IBPS RRB PO Mains Papers
- IBPS RRB PO Previous Papers
- IBPS SO Model Papers
- SBI Clerk Previous Papers
- SBI Junior Associate Model Papers
- SBI PO Model Papers
- SBI PO Previous Papers