Test Index
SBI PO 4 Jan 2021 Paper
Show Para
Direction (54 - 59) -: Study the given information carefully and answer the questions that follow. The given below graph shows the percentage distribution of the number of cakes baked by 5 shops (A, B, C, D and E) on a given day. Total number of cakes baked by the 5 shops were 400. 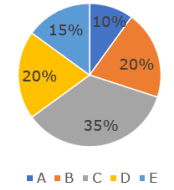 The given below table shows the percentage of cakes ordered from the five shops out of the baked cakes.
Note: Number of cakes unsold = Number of cakes baked – Number of cakes ordered All the ordered cakes are to be considered as cakes sold.
| Shop | Percentage of cakes ordered |
|---|---|
| A | 60% |
| B | 75% |
| C | 80% |
| D | 95% |
| E | 90% |
© examsnet.com
Question : 54 of 100
Marks:
+1,
-0
Go to Question: