Test Index
SBI PO 28 April 2013 Papers
Show Para
Directions (91-95) : Study piechartand table carefully to answerthe questions that follow: Pie-chart showing Percentagewise distribution of cars in fourdifferent states Total cars = 700 Distribution of Cars 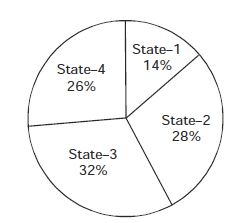 Table showing ratio betweendiesel and petrol engine carswhich are distributed amongfour different states
| State | Diesel Engine cars | Petrol engine cars |
|---|---|---|
| State-1 | 3 | 4 |
| State-2 | 5 | 9 |
| State-3 | 5 | 3 |
| State-4 | 1 | 1 |
© examsnet.com
Question : 92 of 200
Marks:
+1,
-0
Go to Question: