Show Para
Ques No: 31-35
Directions: A pie chart below shows the percentage distribution of employees from the different departments namely A, B, C, D and E and the total number of employees in the company is 560. The following table gives the ratio of males and females corresponding to the departments. Study the pie chart and answer the given questions.
|
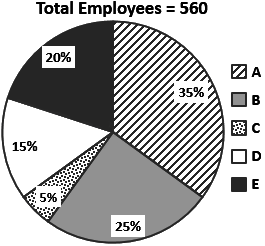
Departments |
The ratio of male employees to female employees |
|
A |
75 : 23 |
|
B |
5 : 2 |
|
C |
2 : 5 |
|
D |
10 : 11 |
|
E |
13 : 15 |
© examsnet.com
Question : 31
Total: 100
Go to Question:
More Free Exams:
- IBPS Clerk Mains Previous Papers
- IBPS Clerks Model Papers
- IBPS Clerks Previous Papers
- IBPS PO Mains Previous Papers
- IBPS PO Model Papers
- IBPS PO Previous Papers
- IBPS RRB Officers Previous Papers
- IBPS RRB PO Mains Papers
- IBPS RRB PO Previous Papers
- IBPS SO Model Papers
- SBI Clerk Previous Papers
- SBI Junior Associate Model Papers
- SBI PO Model Papers
- SBI PO Previous Papers