Test Index
SBI Clerk or Junior Associate Exam Model Paper 4
Show Para
Question Numbers: 39-43The pie chart shows the percentage distribution in food, rent, transport, electricity and others of X out of total expenditure.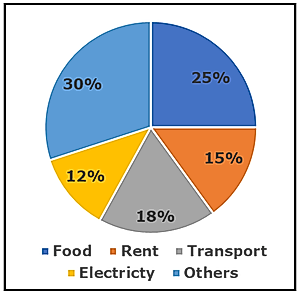 Note – Total Income of X is Rs. 50000. His saving is 10% of his income.
© examsnet.com
Question : 39 of 100
Marks:
+1,
-0
Go to Question: