Test Index
SBI Clerk Exam 5-Jan-2024 Shift 2 Solved Paper
Show Para
Question Numbers: 40-44 Directions: The following line graph shows the number of projects completed in six different months by a company.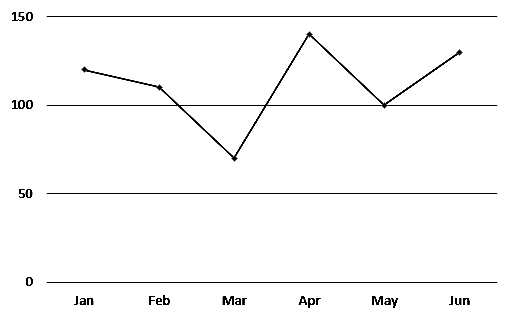
© examsnet.com
Question : 42 of 100
Marks:
+1,
-0
Go to Question: