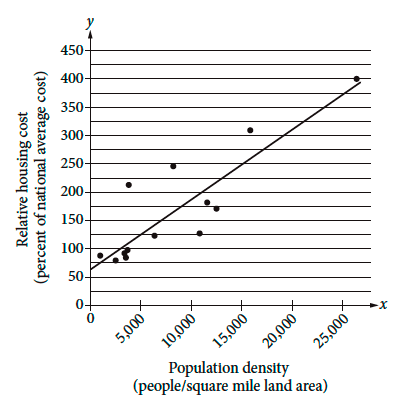
To interpret what the number 61 in the equation of the line of best fit represents, one must first understand what the data in the scatterplot represent. Each of the points in the scatterplot represents a large US city, graphed according to its population density (along the horizontal axis) and its relative housing cost (along the vertical axis). The line of best fit for this data represents the expected relative housing cost for a certain population density, based on the data points in the graph. Thus, one might say, on average, a city of population density x is expected to have a relative housing cost of y%, where
y=0.0125x+61. The number 61 in the equation represents the y-intercept of the line of best fit, in that when the population density, x, is 0, there is an expected relative housing cost of 61%. This mightnot make the best sense within the context of the problem, in that when the population density is 0, the population is 0, so there probably wouldn’t be any housing costs. However, it could be interpreted that for cities with low population densities, housing costs were likely around or above 61% (since below 61% would be for cities with negative population densities, which is impossible).
Choice A is incorrect because it interprets the values of the vertical axis as dollars and not percentages. Choice B is incorrect because the lowest housing cost is about 61% of the national average, not 61% of the highest housing cost. Choice C is incorrect because one cannot absolutely assert that no city with a low population density had housing costs below 61% of the national average, as the model shows that it is unlikely, but not impossible.