Exams Net
Unrestricted Exams Practice
Home
Exams
Banking
CUET
Defence
Engineering
Finance
GATE
Insurance
International
JEE
LAW
MBA
MCA
Medical
Other
Police
PSC
RRB
SSC
State Govt
Subjectwise
Teacher
SET Exams
UPSC
Aptitude
Algebra and Higher Mathematics
Arithmetic
Commercial Mathematics
Data Based Mathematics
Geometry and Mensuration
Number System and Numeracy
Problem Solving
Board Exams
Andhra
Bihar
CBSE
Gujarat
Haryana
ICSE
Jammu and Kashmir
Karnataka
Kerala
Madhya Pradesh
Maharashtra
Odisha
Tamil Nadu
Telangana
Uttar Pradesh
English
Competitive English
CBSE
CBSE Class 10 Solutions
CBSE Class 12 Solutions
CBSE Question Papers (Pdf)
NCERT Books (Pdf)
NCERT Exemplar Books (Pdf)
NCERT Study Notes (Pdf)
CBSE Study Concepts (Pdf)
NCERT Text Book Class 11 Solutions
NCERT Text Book Class 12 Solutions
ICSE Class 10 Papers
Certifications
Technical
Cloud Tech Certifications
Security Tech Certifications
Management
IT Infrastructure
More
About
Contact Us
Our Apps
Privacy
+
-
Default
Dark
Blue
Green
Violet
Crimson
Red
Cafe
Gold
Orange
Olive
Grey
Test Index
Data Interpretation Practice Test 2
Show Para
Hide Para
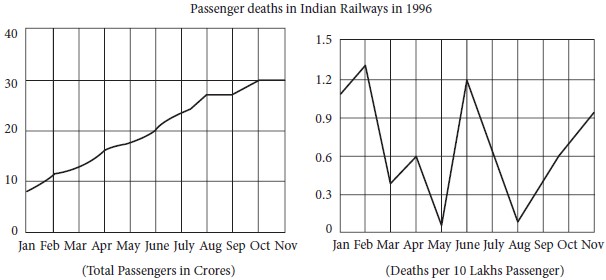
Directions (26-30):
Study the graph given below and answer the questions that follow.
Share question:
© examsnet.com
Question : 30 of 90
Marks:
+1
,
-0
Which of the following statements is wrong?
Excluding November ’96, there weremore deaths in the aggregate, per 10 lakhpassenger, during the odd months thanduring the even months.
There was an increase in passenger flows from January to August ’96.
There has been an increase in passenger deaths every year since January ’96.
There were more passenger killings in November ’96 than in January ’96.
Thirty crore passengers were flown in October ’96.
Validate
Go to Question:
1
2
3
4
5
6
7
8
9
10
11
12
13
14
15
16
17
18
19
20
21
22
23
24
25
26
27
28
29
30
31
32
33
34
35
36
37
38
39
40
41
42
43
44
45
46
47
48
49
50
51
52
53
54
55
56
57
58
59
60
61
62
63
64
65
66
67
68
69
70
71
72
73
74
75
76
77
78
79
80
81
82
83
84
85
86
87
88
89
90
Prev Question
Next Question
Advertisements