Test Index
MAT Exam 2023 Paper
Show Para
Question Numbers: 131-135DIRECTIONS (Qs. 131-135): Analyse the graph/s given below and answer the question that follows.The graph shows the FDI inflows to India, Nepal and Bhutan in US dollars ($ million) for Year I to Year V. 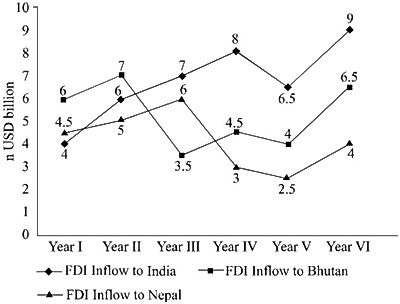
© examsnet.com
Question : 131 of 200
Marks:
+1,
-0
Go to Question: