Test Index
MAT Exam 2023 Paper
Show Para
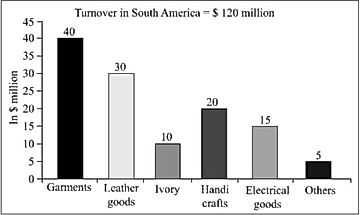
Question Numbers: 126-130QUESTIONS (Qs. 126-130): The pie chart shows percentage turnover of each item in South America by a company M/s Fox. The bar graph gives the turnover in $ millions in South America of various items by M/s Fox. Rest of America refers to those countries which are in America other than Brazil. 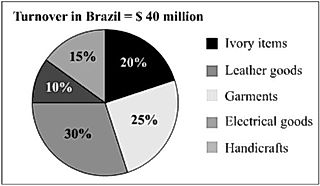
© examsnet.com
Question : 128 of 200
Marks:
+1,
-0
Go to Question: