Test Index
MAT Exam 2021 Paper
Show Para
Question Numbers: 146-150DIRECTIONS (Qs. 146-150) : Study the following graph to answer these questions.The bar graph shows the performance of 3 political parties and C in terms of votes acquired in the elections in a constituency during 2008-2012.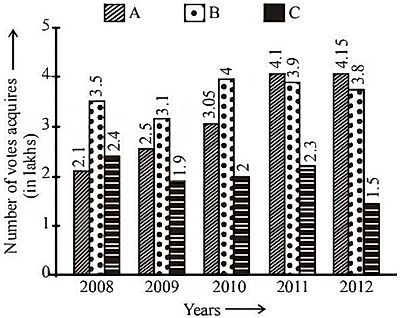
© examsnet.com
Question : 150 of 200
Marks:
+1,
-0
Go to Question: