Test Index
MAT Exam 2020 Paper
Show Para
Question Numbers: 156-160DIRECTIONS (Qs. 156-160): The following bar graph indicates the production of sugar (in lakh tonnes) by three different sugar companies and over the years 2009 to 2013.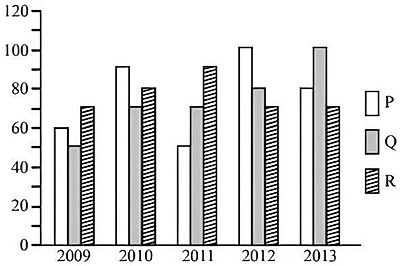
© examsnet.com
Question : 158 of 200
Marks:
+1,
-0
Go to Question: