Test Index
Management Aptitude Test 2018 Paper
Show Para
(Q. Nos. 151-155) Study the following graphs to answer these questions. 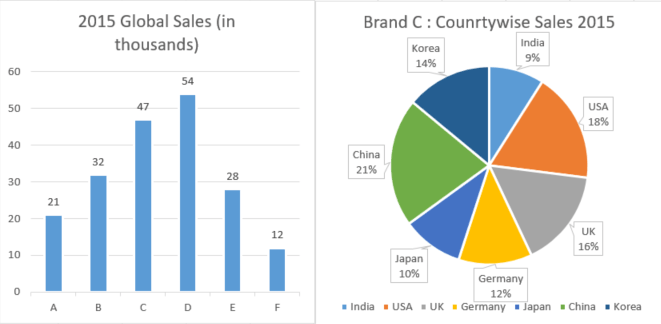 The bar graph below shows the sales of six different cell phone manufacturers in 2015 (in thousands units). The adjoining pie-chart throws the break-up sales of brand ‘C’ alone in the same year for those countries where it is sold.
© examsnet.com
Question : 155 of 200
Marks:
+1,
-0
Go to Question: