Per the Arrhenius equation,
k=Ae−Ea/(RT), where
T is the absolute temperature in kelvin.
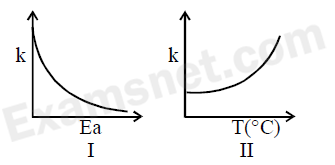
Plot I (variation of k with Ea): at a fixed temperature,
k decreases as
Ea increases, because a larger
Ea makes the exponent
−Ea/(RT) more negative.
The curve therefore starts high on the vertical
k axis and falls steeply at first, then flattens out, approaching
k=0 only for infinitely large
Ea; this is exactly the shape shown in plot I, so I is correct.
Plot II (variation of k with T given in ∘C): with
Ea fixed, raising
T increases
e−Ea/(RT), so
k increases.
The increase is gentle at low temperature and becomes steeper as
T rises, and at
0∘C the value of
k is very small though not zero, so the curve begins essentially near the origin, exactly as shown in plot II; hence II is also correct.
Thus both plots correctly represent the behaviour of a reaction obeying the Arrhenius equation, and the correct option is 'Both I and II are correct'.
The marked option 'I is right but II is wrong' is therefore incorrect.