Test Index
Thermodynamics
Show Para
Paragraph for next two questionsThe entropy versus temperature plot for phases and at 1 bar pressure is given. and are entropies of the phases at temperatures and , respectively.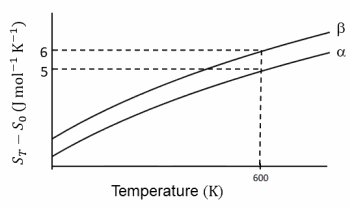 The transition temperature for to phase change is and . Assume is independent of temperature in the range of 200 to and are heat capacities of and phases, respectively.
© examsnet.com
Question : 4 of 40
Marks:
+1,
-0
- Your Answer:
Go to Question: