Test Index
IBPS RRB PO Mains 30 Jan 2021 Paper
Show Para
Question Numbers: 176-180 Direction: Study the bar graph and table carefully to answers the given questions:The following bar graph shows the percentage of mobiles sold by five shops A, B, C, D and E respectively. The total sales is the combination of mobile and tablets.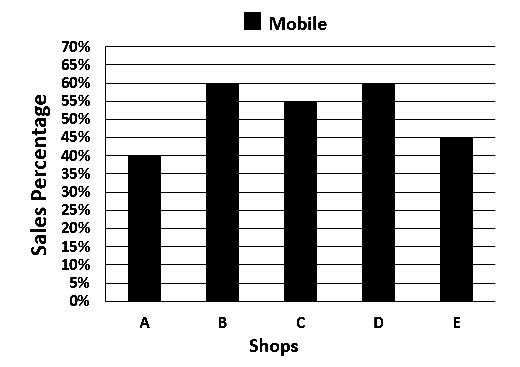 The table shows the average sales of mobile and tablets of five shops.
| Shops | Average sale of Mobiles and Tablets |
|---|---|
| A | 90 |
| B | 70 |
| C | 50 |
| D | 55 |
| E | 60 |
© examsnet.com
Question : 176 of 200
Marks:
+1,
-0
Go to Question: