Test Index
IBPS RRB PO Mains 29 Sep 2024 Paper
Show Para
Question Numbers: 192-197 The pie shows the percentage distribution of the total number of products manufactured in five different companies [P, Q, R, S and T] in 2022. 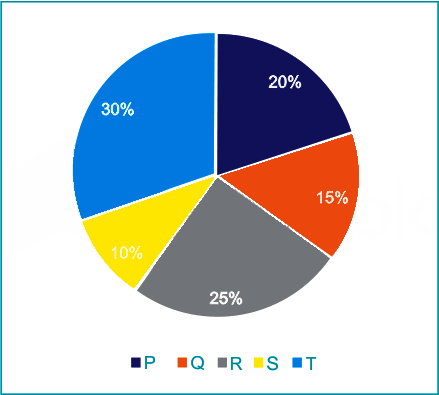 The pie shows the percentage distribution of the total number of products sold by Same five companies in 2022.
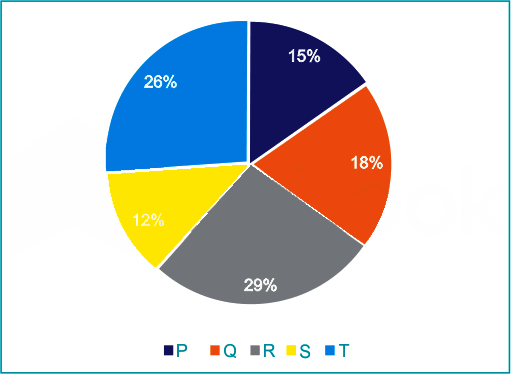 Note – Value first pie chart is 20000 and value of 2nd pie chart is 12000
© examsnet.com
Question : 193 of 200
Marks:
+1,
-0
Go to Question: