Test Index
IBPS RRB PO Mains 13 Oct 2019 Paper
Show Para
Question Numbers: 65-69 Direction: The given line graph shows the number of passengers travelled by 2 cab drivers and the table shows the percentage of females who travelled in the cabs in different months.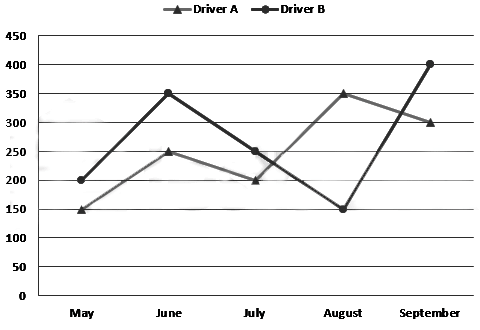
| Month | Driver A | Driver B |
| Percentage of Females | Percentage of Females | |
| May | 30% | 50% |
| June | 50% | 70% |
| July | 20% | 40% |
| August | 60% | 30% |
| September | 40% | 50% |
© examsnet.com
Question : 65 of 200
Marks:
+1,
-0
Go to Question: