Test Index
IBPS RRB Office Assistant Mains 7 Oct 2018 Paper
Show Para
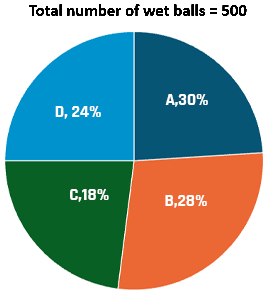
Question Numbers: 196-200 Directions: The first pie-chart shows the percentage distribution of total number of balls (wet + dry) of four companies A, B, C and D. The second pie-chart shows the percentage distribution of the total number of wet balls of the companies. Study the pie-charts and answer the questions that follow.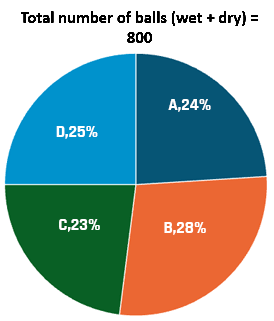
© examsnet.com
Question : 196 of 200
Marks:
+1,
-0
Go to Question: