Test Index
IBPS RRB Office Assistant Mains 20 Oct 2019 Paper
Show Para
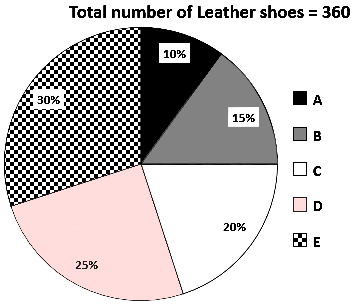
Question Numbers: 75-79 Directions∶ The first pie chart shows the percentage of (Leather + Non-leather) shoes of different brands A, B, C, D and E and the second pie chart shows the percentage of Leather shoes in a particular brand. Read the chart carefully and answer the following questions.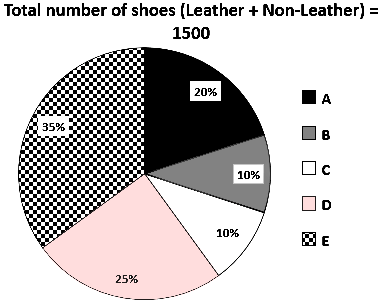
© examsnet.com
Question : 77 of 200
Marks:
+1,
-0
Go to Question: