Test Index
IBPS RRB Office Assistant Mains 20 Feb 2021 Paper
Show Para
Question Numbers: 196-200 Directions: Study the Pie chart and answer the following question.The pie chart is showing the percentage of different types of shirts sold by five different stores namely A, B, C, D and E.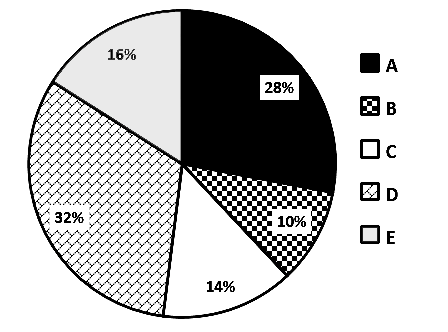
© examsnet.com
Question : 196 of 200
Marks:
+1,
-0
Go to Question: