Test Index
IBPS RRB Office Assistant 2019 Paper
Show Para
Directions (Q. Nos. 51-55) Given bar graph shows the data of two types of school buses X and Y for three schools A, B and C. Study the chart carefully and answer the following questions. 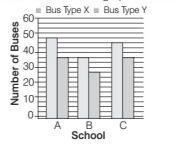
© examsnet.com
Question : 54 of 80
Marks:
+1,
-0
Go to Question: