Test Index
IBPS RRB Office Assistant 17 Aug 2024 Shift 1 Paper
Show Para
Question Numbers: 54-58 Direction: Study the following information carefully and answer based on it.The following bar graph shows the total number of laptops sold by a company over five consecutive years from 2010 to 2014.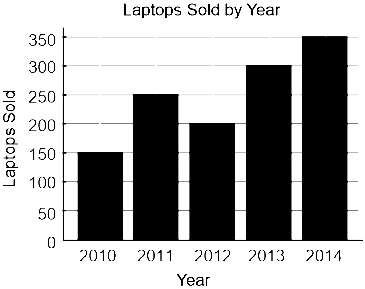
© examsnet.com
Question : 58 of 80
Marks:
+1,
-0
Go to Question: