Test Index
IBPS RRB Office Assistant 17 Aug 2018 Paper
Show Para
Question Numbers: 48-52 The bar graph given below shows production (in cr. units) of five different companies in the month of ‘June’. Read the data carefully and answer the questions.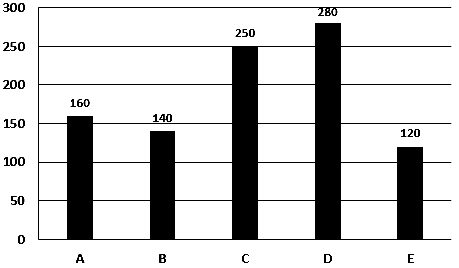
© examsnet.com
Question : 49 of 80
Marks:
+1,
-0
Go to Question: